Each of our inside sales reps at InsightSquared is a “mini-CEO,” as my friend Aaron Ross calls them. This is because they analyze all their own business by themselves. They fully own not only their quota number, but all of their sales performance analysis as well.
I’ve noticed many sales reps in the SaaS space don’t have any sort of real-time context of what’s going on with their performance metrics because they don’t do their own sales analysis – that information is usually owned by their sales managers. This is a mistake in my opinion because a sales rep is always more empowered to succeed when they truly understand their data in detail. Radical transparency of performance metrics also leads to more trust and better accountability.
So, at the end of every month and quarter, my sales reps meet and give individual presentations on their selling results, and then deliver their strategic plan for how to hit their number next month or quarter. Here, I’ll share with you an example of a slide deck for a fictional sales rep I’ll name Bobby Cash.
You can download a PDF version of these slides here.
Slide 1: Sales Review Summary
What: Bobby’s summary of the quarter’s results for key sales performance metrics.
Why: It’s the logical place to start to set the context for the rest of the presentation.
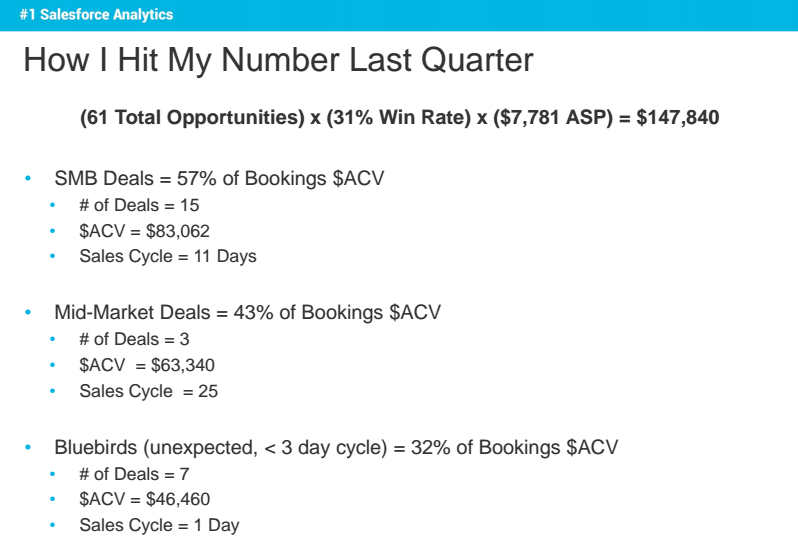
Slide #2: “How I Hit My Number Last Quarter”
What: The “Sales Formula” at the top of the slide breaks down Bobby’s final sales bookings number ($147,840) into the actual number of total opportunities that he worked during the quarter (meaning both won Opps and lost Opps), multipled by his Win Rate % during Q1, and also multiplied by his $ average deal size. These were the overarching components that explain how he got to his number.
Next, Bobby broke down his won deals into segments: SMB, Mid-Market (MM) and bluebirds that were slightly unplanned for. How you segment deal size varies by company, but here, we use SMB (small- to mid-sized businesses), MM (mid-market), and bluebirds (deals that came up out of the blue and had a sales cycle of less than 3 days).
Why: Breaking down key components of won business shows how your rep hit their number. It can also tell you a lot about where they focus their efforts and what their strengths are.
Reps who don’t hit their number would title this slide “Why I Didn’t Hit My Number Last Quarter.” This isn’t to incite shame, by any means – it is a learning opportunity for both the rep who didn’t make quota and for the rest so that they can grow and improve.
Slide #3: Bookings & $ASP Compared to Prior 3 Quarters
What: This chart shows how Bobby’s bookings are trending over time. The green bars represent closed-won deal value, while the blue line shows number (# count) of closed-won deals.
Why: Comparisons like this show trends reps can glean actionable insights from. They allow reps to truly understand their $ASP over time, which informs them of where they’re heading for the future. Are they growing? When deal number decreases while sales bookings increase, that means that $ASP went up during that period. Notice that his Q1 $ASP is down since Q4, but is up over Q2 and Q3 in 2013.
Slide #4: Quarterly Pipeline Summary
What: These are Bobby’s pipeline changes (i.e. opportunities flowing into and out of his sales pipeline) during the course of Q1. The stage buckets (1: 3, 2: 2, 3: 0, 4: 1) simply mean how many opportunities were at each stage at the start of Q1: Stage 1 had 3 opportunities, Stage 2 had 2, and so on. This slide also shows how many opportunities were worked and ultimately closed (both won and lost) . It also shows Bobby’s created opportunities (inflow) and how many he ended up with at the end of Q1 (i.e. how many opportunities were in his pipeline entering Q2).
Why: Pipeline summaries help your reps understand their pipeline flow. Does they have enough opportunities in their pipeline to hit their number? If opportunities aren’t flowing in, they aren’t going to close business. By breaking it down into a summary, they can better understand how much pipeline they won and lost – and over time, they’ll pick up the overall flow.
Slide #5: Pipeline Inflow/Outflow Compared to Prior 3 Quarters
What: Visualizes how Bobby’s pipeline inflow and outflow trend over time. Shows outflow both in won deals (purple) and lost opportunities (red).
Why: To keep Bobby’s pipeline growing, he needs more opportunities to flow in over time. His quota will inevitably grow from quarter to quarter, so he needs to know whether his pipeline growing with it. Good news for Bobby – his gained many more opportunities in Q1 than over the previous 3 quarters. It’s important for reps to know whether their pipelines and net flow are growing over time. Visualizing the trend helps reps plan their strategy better.
Slide #6: Insights from Mid-Month Forecast During Last Month of the Quarter
What: A review of Bobby’s mid-month forecast, which was midway through the last month of Q1. We ask each rep to analyze how accurate he or she was.
Why: This induces some thinking and more careful approach next time based on the learnings from the previous selling period. It’s really important for reps to be able to forecast the expected value of your bookings accurately at the end of the selling period so they can plan ahead for how they’ll hit their quota. This also helps sales managers and executives sleep better at night, knowing their reps have a handle on diagnosing their opportunities.
Although this is a quarterly sales review, we look at forecasts at more frequent intervals than just quarterly.
Slide #7: Win Rate by # Count
How did Bob get to the number of 32 opportunities in Stage 2? And why are we asking him to do this only for Stage 2?
First, he projects that his conversion rates by stage will be the same in Q2 as they were in Q1. His Q1 win rate % (i.e. % of opportunities won from top of the funnel all the way to closed-won) was 31%, as indicated by the highlighted box in the table under the sales funnel.
However, opportunities in Stage 1 are very early stage and only recently qualified; Stage 2 is when reps feel much stronger about the key qualification criteria – and Bobby’s from Stage 2 is 56%. In other words, he wins more than half of his opportunities that get to Stage 2. So, in the interest of a more accurate forecast, we ask our sales reps to calculate how many opportunities would be needed to reach Stage 2 of the sales funnel in order to hit their numbers. With a 56% win rate from Stage 2, a $150k quota, and a $8.5k ASP, here is how Bobby calculated the number of opportunities needed in Stage 2:
-
$150k quota / $8.5k ASP = 18 closed-won deals needed to reach quota
-
18 deals / 56% win rate from Stage 2 = 32 opportunities in Stage 2 to reach quota
Slide #8: % Win Rate Compared to Prior 3 Quarters
What: Bobby’s % Win Rate trending over time.
Why: This is a great indicator of how Bobby’s sales skills are improving. Remember to take everything in context, as this can be circumstantial. In Bobby’s case, he had actually anticipated a lower win rate in Q1’14 because his company experienced a big boost in the quantity of new Mid-Market (larger-sized deals). This is why we filter this report by segments and deal sizes as well as by lead sources, and we have each rep look carefully into their consistency in these categories. Generally, win rate over time is worth monitoring to ensure that wins aren’t slipping through the cracks.
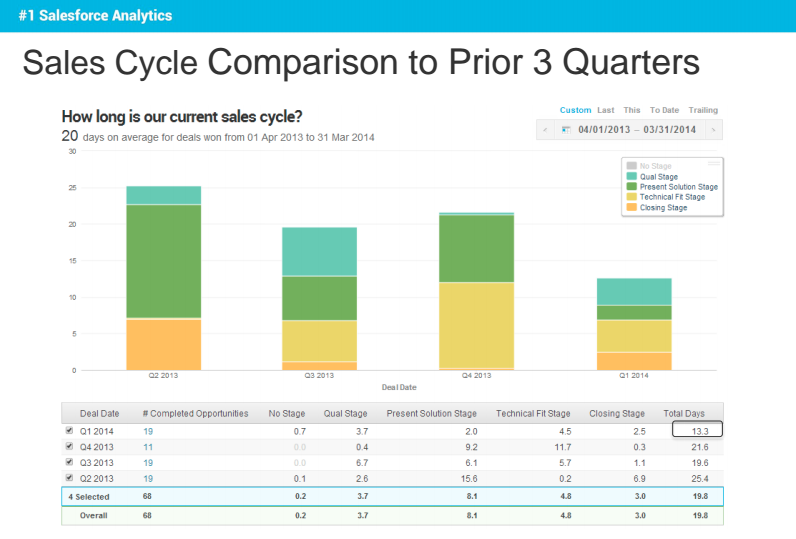
Slide #9: Sales Cycle Compared to Prior 3 Quarters
What: Sales cycle length over time overall and by stage.
Why: Bobby should be proud that his sales cycle is decreasing over time – particularly the “Present Solution” stage, which was either his longest or second longest stage in the last year. This is an encouraging trend. If Bobby’s sales cycle was increasing rather than decreasing, he should be wary of how much and at which stage so he can be sure he’ll hit his number in the current selling period (that he won’t miss his number if the deal falls into the following selling period due to an extended cycle).
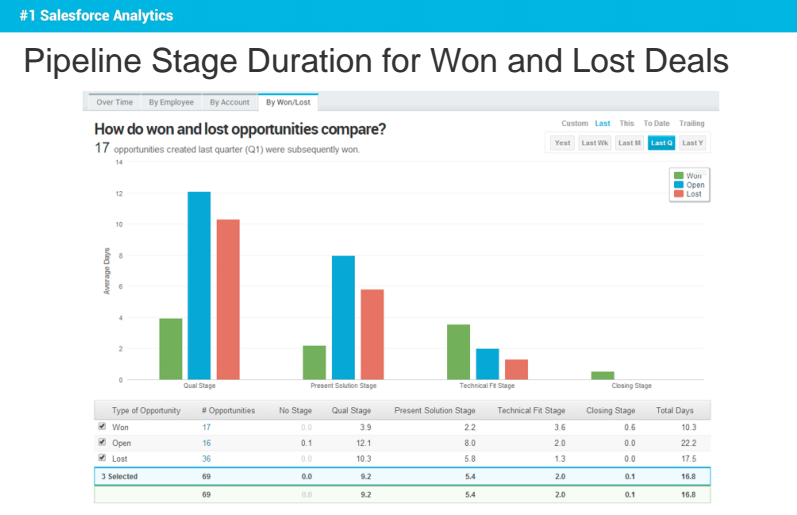
Slides #10: Pipeline Stage Duration for Won and Lost Deals
What: Number of days closed-won, closed-lost, and open opportunities spent in each stage of the sales process.
Why: Deals that Bobby eventually closed-won spent much less time on average in Stages 1 (3.9 days) and 2 (2.2 days) than those who were closed-lost. This is really useful information for him to know – in Q2, he needs to consider purging opportunities that stay in those stages more than a few days. Ultimately, they will become much better forecasters and be able to spend their time on opportunities that are more likely to win.
Unsure whether to purge opportunities in your pipeline? Read this post on knowing when to purge at-risk opportunities.
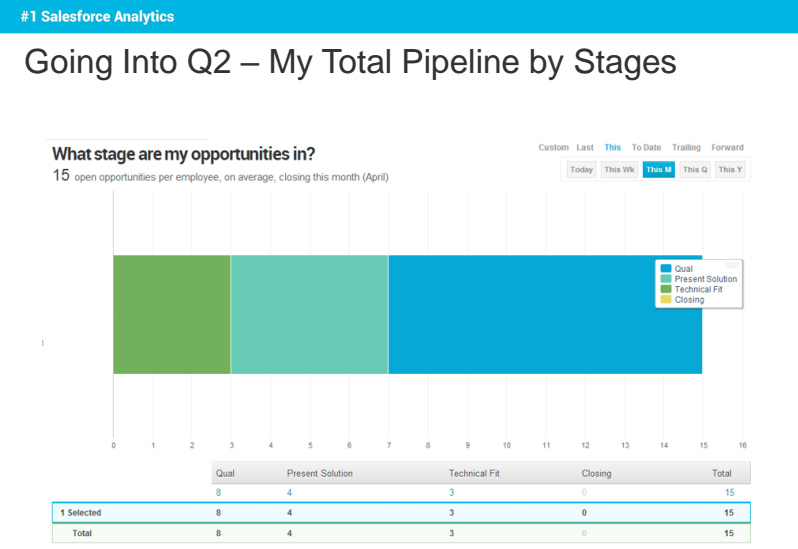
Slide #11: Total Pipeline by Stage Going into Q2
What: Shows Bobby how many opportunities are in his pipeline at the start of Q2 and what stage they’re in.
Why: Use this as a form of checks-and-balances to make sure there is strong distribution in your reps’ pipelines from early stage to late stage and especially enough in the late stage to close business. Ideally, you want a careful distribution so your reps can close deals early in the month and backfill with new and early-stage opportunities.
But don’t jump to any conclusions without taking sales cycle into consideration. For example, Bobby tends to have short sales cycles, so it’s encouraging to know that he already has late-stage opportunities in his pipeline that he could work to win quickly.
If he didn’t have short sales cycles, use this time to brainstorm ways to push some of those early-stage opportunities forward. If this chart showed too many opportunities in late stage, talk about how Bobby could prospect and work with marketing to fill his pipeline.
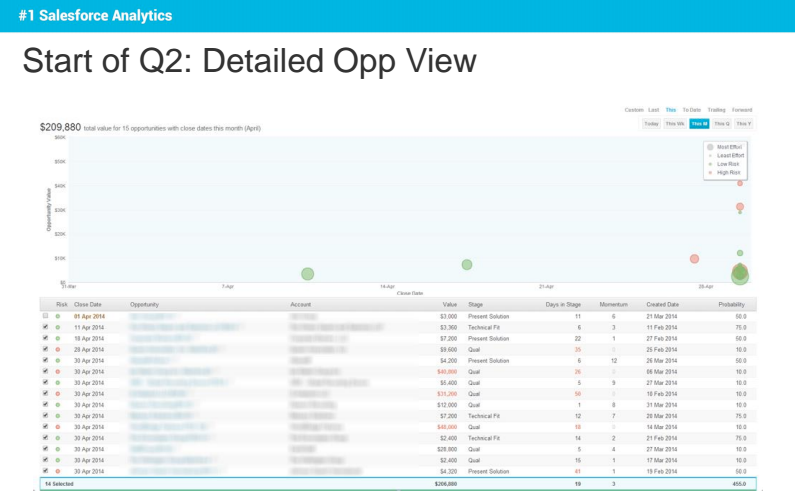
Slide #12: Detailed View of Open Opportunities at Start of Q2
What: A more detailed view of the open opportunities in Bobby’s pipeline going into Q2: when they are scheduled to close, how much effort they’ve taken (big circle vs. small circle), and how likely they are to close (green vs. red).
Why: This is just another way Bobby can visualize the open opportunitie sin his pipeline and how many of those are likely to win. He has some strong opportunities open, but some are flagged as at-risk because they have a considerably larger-than-average $ASP or because they were stuck in the pipeline longer than his average win cycle. He gets to discuss these in the part of the Q1 Sales Review presentation that focuses on planning ahead for Q2. The rest of the team can pressure test these and give insights and support to each other to help win deals.
Slide #13-14: What I’m Most Proud Of & Where I Need To Improve
Give your reps the opportunity to mention what they were proud to accomplish last quarter and celebrate this progress with them. Then, have them critique their performance so they are aware of how to improve during the upcoming quarter. Finally, they can summarize their key learnings from the quarter in a few bullet points. Peers can offer advice on how to tackle the skills they need to improve on.
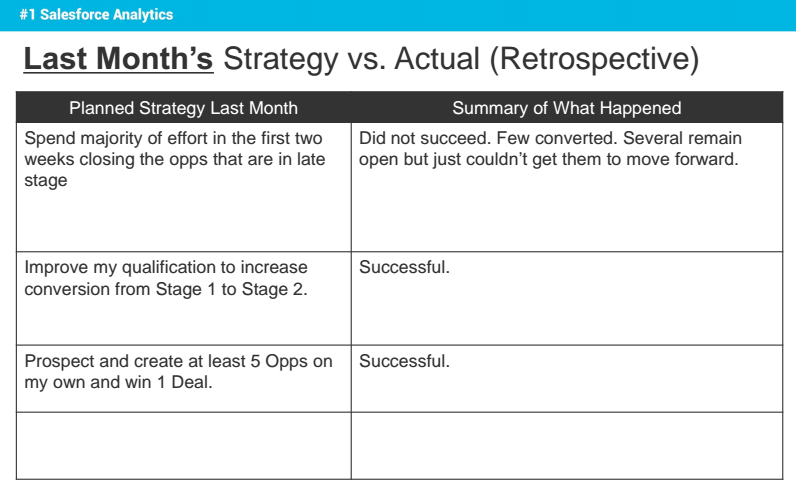
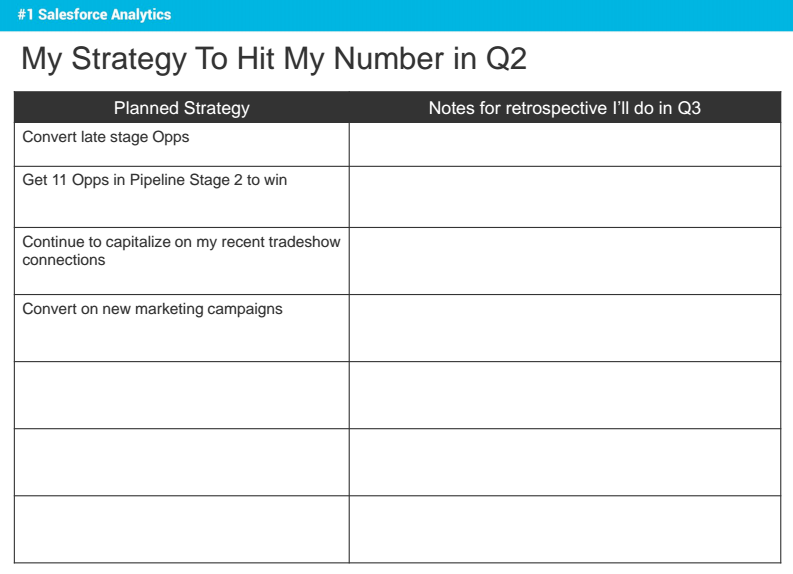
Slides #15-16: Last Month’s Strategy vs. Actual + Strategy to Hit My Number in Q2
This is similar to most team’s strategies vs. actuals analysis for the quarter. Every quarter should begin with specific personal performance goals each individual rep makes for himself, and at the end of each quarter, your reps should evaluate whether or not they achieved those goals. If they didn’t succeed, have them explain why or why not.
Regarding new plans for the quarter, push them to create goals with numbers in them so they can more easily keep their eyes on the prize.
For reference, you can download a PDF version of these slides here. How do your sales reps review the quarter?
